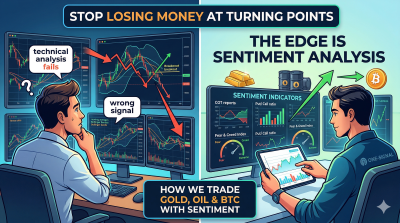
Most traders lose money at turning points. Not because they lack data — but because they're reading the wrong signals at exactly the wrong moment.
Sentiment indicators trading changes that. While technical analysis tells you what price has done, sentiment analysis tells you what the crowd believes — and when that belief becomes extreme, markets reverse. Reliably. Systematically. Across assets.
At ONE-SIGNAL, market sentiment analysis sits at the core of our methodology. Over 20+ years of proprietary research, we've tracked the moments where crowd psychology detaches from fundamentals — and positioned accordingly. This post breaks down how sentiment indicators work, why they outperform technical analysis at major turning points, and how we apply them across Gold, Silver, Oil, and BTC.
This is not financial advice. Past performance is not indicative of future results.
What Are Sentiment Indicators — and Why Do They Work?
Sentiment indicators measure the emotional state of market participants: how bullish or bearish traders and investors are positioned right now. Unlike price charts, which describe history, sentiment indicators describe psychology — and psychology is what drives markets to their extremes.
The core logic is contrarian: when everyone is bullish, there are few buyers left. When everyone is bearish, there are few sellers left. Extremes in sentiment consistently precede reversals.
Key sentiment tools include:
- Commitment of Traders (COT) reports — tracks net positioning of commercial hedgers, large speculators, and small traders across futures markets
- Put/Call ratios — measures options market fear vs. greed
- The Fear & Greed Index — aggregates volatility, momentum, and breadth signals into a single sentiment score
- Sentiment surveys (AAII, CNN, etc.) — direct polling of investor bias
Used in isolation, each has noise. Used in combination, and calibrated against price structure and fundamentals, they become one of the most powerful timing tools available.
Technical Analysis vs. Sentiment Analysis: What's the Real Difference?
Technical analysis is reactive. It identifies patterns in historical price and volume data — support/resistance levels, moving average crossovers, RSI divergences. These are lagging signals by definition: they describe what happened, then infer what might happen next.
The problem is structural. In trending markets, technical signals work well. But at major turning points — exactly where the highest-reward opportunities exist — technical analysis consistently fails. Why? Because turning points occur precisely when the prevailing trend has generated the most momentum and the most consensus. Breakouts fail. Support lines break. Indicators give contradictory readings.
Sentiment analysis is different. It's not a trend-following tool. It's a mean-reversion timing tool — designed to identify when psychological extremes make continuation statistically improbable.
A practical illustration: In early 2020, before the COVID crash, large speculator positioning in Gold futures hit multi-year highs. Technically, Gold looked strong. Fundamentally, it looked supported. Sentimentally, it was saturated. Traders positioned for "more up" had already bought. The reversal was a positioning unwind, not a fundamental shift. Technical indicators did not warn of it. Sentiment did.
How We Use Sentiment for Gold Trading Signals
Gold is the asset where sentiment analysis has the longest and most consistent track record.
Gold's investor base is uniquely emotional. It attracts fear-driven buyers (inflation hedgers, macro bears, crisis traders) and momentum chasers in roughly equal measure. The result: sentiment extremes in Gold are more reliable reversal signals than in almost any other asset.
Our approach to gold trading signals incorporates:
- COT positioning — when large speculators (managed money) hit net long extremes, we treat this as a caution signal. When they hit net short extremes, we treat this as a buying opportunity.
- Gold/Silver ratio dynamics — sentiment divergence between Gold and Silver often precedes moves in both
- Dollar sentiment overlay — USD sentiment extremes frequently coincide with Gold turning points, given their inverse correlation
In 2025, ONE-SIGNAL's Gold signal returned +64.21%, versus a buy-and-hold of +23.23% annualized. Sentiment-driven timing — not technical entry — drove the difference.
Past performance is not indicative of future results. This is not financial advice.
Oil: The Asset Where Sentiment Divergence Is Most Predictable
Oil presents a unique sentiment environment because it has two distinct player types: commercial hedgers (producers, refiners) who hedge systematically, and speculative money (funds, algos) who trade trend.
When speculative positioning reaches extremes — in either direction — mean reversion typically follows. This is well-documented in COT data going back decades.
What makes market sentiment analysis particularly powerful for Oil is the divergence between commercial and speculative sentiment. Commercials are structurally short (hedging production). When they reduce their shorts significantly while specs are heavily long, it signals a supply/demand imbalance that usually resolves with a price move against the spec crowd.
Our Oil signal has historically captured major reversals — including short positions — that technical analysis alone would not have flagged. In 2025, our OS Oil strategy returned +48.88% despite Oil futures themselves returning -19.99% over the same period.
BTC: Using the Fear & Greed Index as a Systematic Edge
Crypto is the asset class most visibly dominated by retail sentiment — which makes it the most natural home for a contrarian trading strategy.
The Fear & Greed Index for Bitcoin aggregates volatility, market momentum, social media sentiment, surveys, and market dominance into a 0–100 score. At extremes:
- Greed (>75): Market euphoria, late-cycle buyers dominating, high reversal risk
- Fear (<25): Capitulation, forced selling, historically high-probability buy zones
The challenge is that the Fear & Greed Index alone generates false signals. Retail crypto can stay greedy for weeks. Our approach uses it as a component within a broader sentiment framework — cross-referenced with BTC futures positioning, funding rates in perpetual markets, and on-chain metrics like exchange inflows.
When all three sentiment layers align at extremes — that's a high-conviction signal. In 2025, our OS BTC STOP strategy returned +161.34% on this basis.
Past performance is not indicative of future results. This is not financial advice.
The Contrarian Trading Strategy Framework Behind ONE-SIGNAL
What we're describing is a systematic contrarian trading strategy — not a gut-feel or narrative-driven one.
The core logic:
- Identify sentiment extremes — absolute readings and rate-of-change matter equally
- Confirm with positioning data — sentiment surveys reflect opinions; COT data reflects actual capital deployed
- Check fundamental backdrop — sentiment extremes that align with stretched fundamentals are higher conviction
- Wait for a price trigger — sentiment tells you when the setup exists; price structure confirms when to enter
- Size proportionally to conviction — extreme sentiment + extreme positioning + price confirmation = maximum allocation
This is not a system that trades every signal. It is a system designed to identify the subset of market moments where the probability distribution is skewed — where the crowd is wrong by construction, and the reversion is both likely and potentially large.
Why Most Traders Don't Use Sentiment Indicators — and Why That's Your Edge
The paradox of sentiment analysis is that it requires acting against the prevailing narrative. When Gold sentiment is at extreme bullishness, every financial news outlet is writing bullish Gold stories. When Fear & Greed is at extreme fear in BTC, Twitter is full of capitulation posts and price-target cuts.
Acting against that consensus is psychologically difficult. Which is exactly why the edge persists.
Technical analysis is widely taught, widely used, and therefore increasingly crowded. Sentiment analysis — particularly the systematic, multi-layer version we employ — requires proprietary data, long-horizon research, and the discipline to act against the crowd at moments of maximum emotional pressure.
That's what 20+ years of ONE-SIGNAL's methodology has built.
Conclusion: Sentiment Indicators Trading Is the Edge That Compounds
Technical analysis has its place. But at major turning points — where the largest risk-adjusted returns are available — market sentiment analysis consistently outperforms.
For Gold, Oil, and BTC specifically, sentiment extremes are both more frequent and more reliable than in equity markets. The data is available, the patterns are consistent, and the edge is real.
ONE-SIGNAL's signals are built on this foundation. Not on lagging indicators and chart patterns, but on understanding what the crowd believes, when they're wrong, and how to position before the turn.
Want the signal before the turn?
ONE-SIGNAL delivers daily trading signals for Gold, Silver, Oil, BTC, and S&P 500 — built on 20+ years of sentiment and systematic research.
Start your free trial →
Past performance is not indicative of future results. This content is for informational purposes only and does not constitute financial advice.

